Choosing an apprenticeship training provider isn’t straightforward.
There’s a lot of information available, but not all of it is useful. Employer reviews, provider size, and brand recognition often shape decisions, even though they don’t always reflect the quality of outcomes.
At the same time, the data that does show how providers actually perform already exists. It’s published and widely used across the education sector, but for many employers it isn’t easy to access or compare.
One of the most important of these measures is QAR.
What is QAR in apprenticeships?
In basic terms, QAR (Qualification Achievement Rate) measures the percentage of learners who successfully complete an apprenticeship compared to those who started.
In the education and training sector, QAR is a standard measure of apprenticeship quality. But for many employers, it’s not a term that comes up often.
That gap matters, because QAR provides a clear and consistent way to understand how reliably a training provider supports learners through to completion.
What do apprenticeship achievement rates tell you?
Apprenticeship achievement rates, or QAR, give a direct view of outcomes.
They help answer a simple but important question: how often do learners actually complete their apprenticeship with this provider?
A higher QAR generally indicates that a provider is:
-
- Supporting learners effectively throughout the programme
- Delivering consistent training across cohorts
- Helping apprentices reach successful end points
A lower QAR can point to challenges in delivery, support, or learner progression.
While it’s not the only metric to consider, it’s one of the few that reflects real outcomes rather than activity.
Why does QAR matter to employers?
When choosing an apprenticeship provider, outcomes matter more than activity.
Metrics like starts or provider size can suggest scale, but they don’t show whether learners complete their training. QAR fills that gap by focusing on achievement.
For employers, this has direct business impact.
A completed apprenticeship means:
-
- Skills that can be applied in the role
- A more stable and productive workforce
- A clearer return on training investment
Lower completion rates can lead to:
-
- Delays in filling roles
- Lost productivity
- Additional recruitment or training costs
QAR doesn’t tell you everything about a provider, but it does give a strong indication of how often their programmes lead to successful outcomes. That makes it a useful starting point when comparing providers.
Why is QAR often overlooked when choosing an apprenticeship provider?
If QAR is one of the most useful measures of apprenticeship outcomes, why isn’t it used more often when employers compare providers?
In most cases, it comes down to access and visibility.
Apprenticeship achievement rate data is published, but it isn’t always easy to find or interpret.
It can sit across different sources, vary by programme, and take time to piece together. For employers making decisions alongside their day-to-day responsibilities, that level of effort isn’t always practical.
As a result, provider comparisons often rely on more visible or familiar indicators, such as:
-
- Provider reputation or brand recognition
- Recommendations from peers or networks
- The number of learners a provider works with
These factors can be useful, but they don’t show how consistently a provider delivers successful apprenticeship outcomes.
There’s also the challenge of context. Looking at a single QAR figure in isolation doesn’t always give a complete picture. Employers need to understand how performance varies across programmes, and how it compares to national benchmarks or similar providers.
Because of this, apprenticeship outcome data can end up being underused, even though it’s one of the most direct indicators available.
Making better use of QAR doesn’t require new metrics. It requires making existing data easier to access, compare, and apply in real decisions.
How to use QAR when comparing apprenticeship providers
QAR is a useful starting point when comparing apprenticeship providers, but it works best when it’s considered in context.
Looking at a single achievement rate on its own doesn’t always tell the full story. To make a fair comparison, there are a few additional factors worth considering:
1. Consider learner volume alongside achievement rates
A high QAR is a positive signal, but it’s important to understand what sits behind it.
For example, there’s a difference between:
-
- A provider with a 100% QAR based on a single small cohort
- A provider with an 80% QAR across a much larger number of learners
Both figures are strong in different ways. One reflects consistency within a small group, while the other shows performance at scale.
Learner volume adds important context to achievement rates and helps you understand how reliable those outcomes are.
2. Check programme-level achievement rates
Overall QAR gives a broad view, but performance can vary across different apprenticeship programmes.
A provider might deliver strong outcomes in one area, while results are more mixed in another.
Looking at programme-level achievement rates helps you understand:
-
- Where a provider performs most consistently
- Whether outcomes align with the specific role or standard you’re hiring for
3. Compare QAR against national benchmarks
QAR is most useful when it’s viewed alongside a benchmark.
Comparing a provider’s achievement rates to the national average for the same programme or sector helps answer a key question:
Are their outcomes above or below the national benchmark?
This gives a clearer sense of relative performance, rather than looking at figures in isolation.
4. Look for consistency across apprenticeship provision
Consistency can be just as important as the headline achievement rate.
A provider with stable performance across multiple programmes and cohorts may offer more predictable outcomes than one with more variation.
This is particularly relevant for employers planning long-term recruitment or scaling apprenticeship programmes over time.
5. Use QAR alongside other provider quality indicators
QAR is one of the most useful indicators of apprenticeship outcomes, but it isn’t the only factor to consider.
It works best alongside other information, such as:
-
- Ofsted ratings and quality of education
- Employer feedback and support structures
- The provider’s experience delivering specific programmes
Taken together, these give a more complete picture of how a provider is likely to perform.
Compare apprenticeship providers using QAR data
Using QAR effectively means bringing together multiple data points, including cohort size, programme-level performance, and benchmark comparisons.
In practice, that isn’t always straightforward.
Achievement rate data is publicly available, but it can take time to find, interpret, and compare across different providers and programmes. For many employers, that makes it difficult to use QAR as part of everyday decision-making.
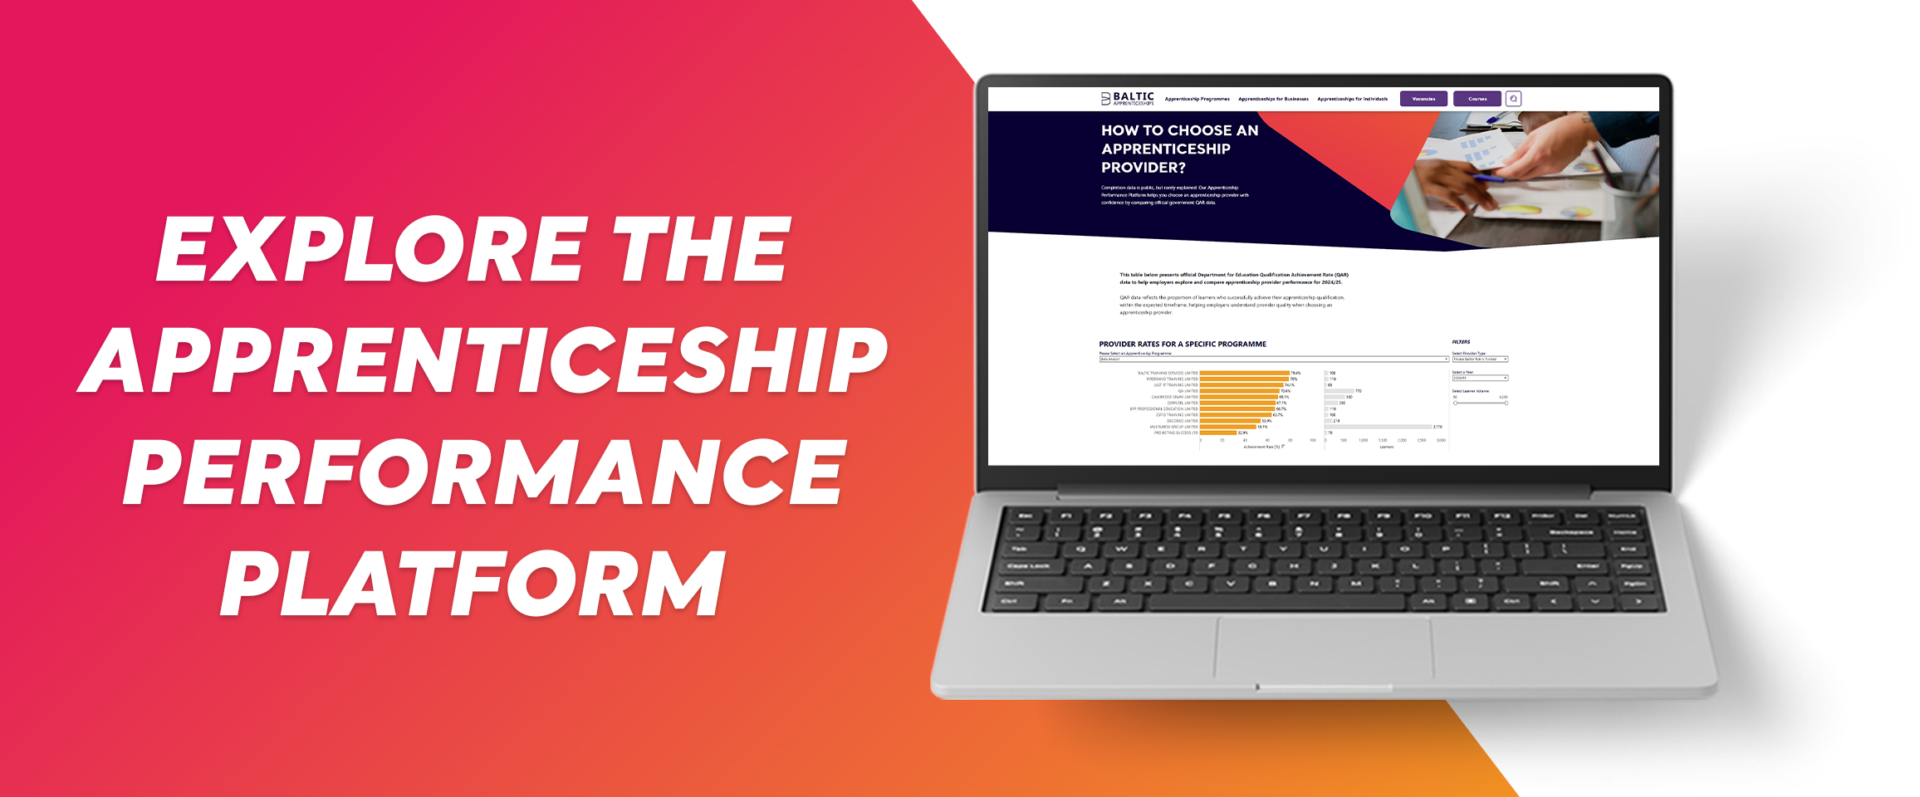
We built a way to simplify that process.
Our apprenticeship performance platform brings together:
-
- Achievement rates for all providers
- Programme-level data across standards
- National benchmark comparisons
- Side-by-side provider comparisons
All in one place.
This makes it easier to sense-check performance, compare providers on a like-for-like basis, and build a clearer picture of outcomes before making a decision.